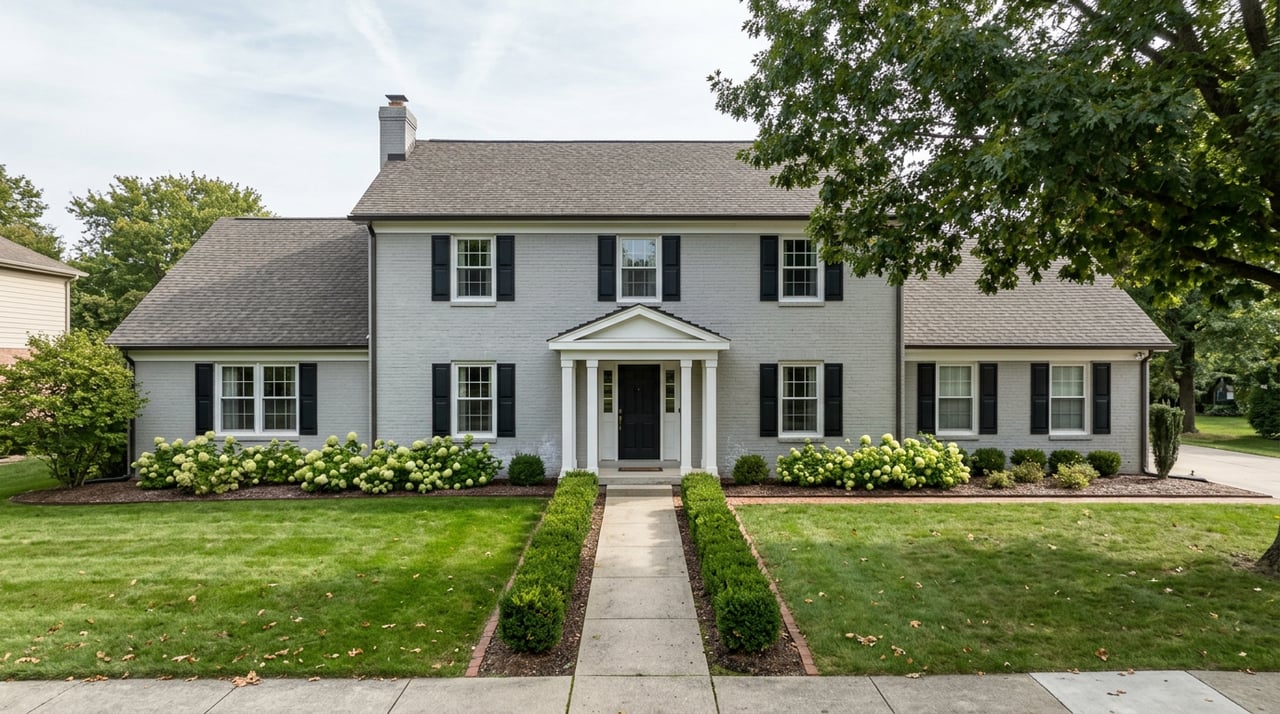
A buyer relocating to York County usually starts the same way. They search "York PA home prices," land on a number around $300,000, and build a mental budget around it. Then they start looking at actual listings in York City and the number stops making sense. Rowhomes in the $130,000s. A twin at $155,000. Nothing close to the figure they had in their head.
They are not looking at a broken market. They are looking at proof that the county median was never describing York City in the first place.
One Number, Two Housing Markets
The REALTORS Association of York & Adams Counties, known locally as RAYAC, tracks home sales across the county every month and publishes them by school district, not just as one blended figure. In its 2025 year-end report, RAYAC recorded a countywide median sale price of $304,900, a 7 percent increase over 2024. Realtors closed 5,548 sales that year for a combined dollar volume above $1.79 billion, and the median days on market sat at just 9 days, the third fastest pace in the county's recorded history.
That $304,900 figure is the number every portal repeats. It is also an average built from two housing markets that share a county line and almost nothing else. RAYAC's own school-district breakdown for 2025 put the median sale price in the York City school district at $160,000, while the Northern school district submarket closed at $400,000. That is a $240,000 spread sitting inside one countywide median, and it means the "York County price" a relocating buyer sees on a portal describes neither end of that range particularly well.
"We're continuing to see strong price appreciation in York County," said Allison Altman, 2026 RAYAC President, in the association's March 2026 housing snapshot. "The median sold price has reached $300,000, representing an 8% increase over last year, which underscores the continued demand for homeownership in our region."
That quote is accurate for the county as a whole. It tells a buyer almost nothing about what a specific rowhome on a specific block in York City will actually cost, because the county figure is doing the statistical equivalent of averaging a bicycle and a truck and reporting the mileage.
The Two Ends of the Spread
| Submarket (RAYAC school district) | 2025 median sale price |
|---|---|
| York City | $160,000 |
| Northern | $400,000 |
That table is the whole argument. A buyer comparing "York" to a market they already know, or a seller trying to figure out whether their asking price is realistic, is not comparing apples to apples if they anchor to the countywide $304,900 instead of the submarket their address actually sits in.
Why the Portals Disagree With Each Other Too
The confusion is not limited to RAYAC's countywide number versus its own school-district data. Pull up York on any major portal and you will get a different answer depending on which geography and which metric it is measuring.
Redfin's county-level data for March 2026 showed a median sale price of $290,000 for York County, up 0.3 percent year over year, with homes selling in about 20 days. Narrow that same source down to the city of York specifically and the March 2026 figure drops to roughly $170,000, down 4 percent year over year, with homes taking closer to 26 days to sell. Same provider, same month, two numbers nearly $120,000 apart, because one is measuring the county and the other is measuring the city.
Zillow adds a third wrinkle. Its city-level figure for York landed near $282,926 as of July 2026, up 3.4 percent over the prior year. That number is closer to the county median than to the city's own sale prices, because Zillow's figure is an estimated average home value, not a median of actual closed sales. Average versus median and estimated value versus closed price are two more variables buried inside what looks like a simple question: what does a home in York cost.
None of these sources are wrong. They are answering different questions with the same word.
What's Actually Driving the Gap
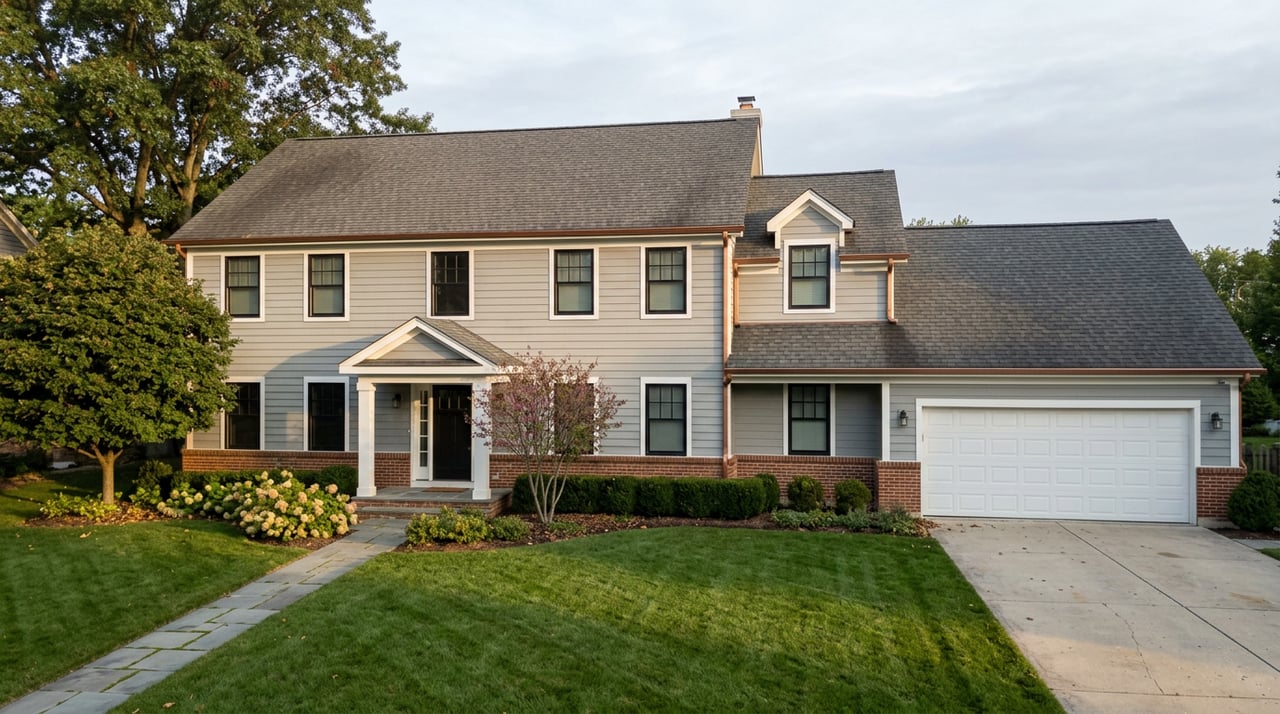
The $240,000 spread between York City and the Northern submarket is not a mystery. It comes down to housing stock. York City's inventory is dominated by rowhomes, twins, and older detached homes built close together on smaller lots, much of it dating to the early twentieth century when the city was a dense manufacturing center. The Northern submarket's inventory skews toward larger, newer-construction single-family homes on bigger lots. Different housing stock at different sizes and ages produces different price bands. That is the entire mechanism, and it is the same reason a countywide median can climb 8 percent year over year while a specific city block barely moves.
This matters for pricing decisions on both sides of a transaction. A York City seller who prices a listing off the county median will likely overshoot the market for their actual submarket. A buyer comparing York's "affordability" against a market they are leaving needs to know whether they are comparing against the $160,000 city figure or the $400,000 Northern figure, because those are functionally two different real estate markets wearing one county name.
How to Actually Use This Number
If you are searching York from outside the area, or comparing it against another county before deciding where to look, a few adjustments make the comparison worth something:
- Ask which school district or submarket a listing sits in before anchoring to its price. RAYAC publishes monthly snapshots broken out this way, and that breakdown is a better starting point than a single county figure.
- Separate the metric from the geography. A "median sale price" and an "average home value" are not interchangeable, and a city figure and a county figure are not interchangeable either, even when they come from the same source.
- Treat the countywide number as context, not a budget. It tells you the county is appreciating. It does not tell you what your specific street costs.
A Few Questions Worth Settling Upfront
Does a lower median in one district mean the housing is worse? No. The price difference tracked here reflects housing type, age, and lot size, not a judgment on any neighborhood. A York City rowhome and a Northern-district colonial are different products, not different tiers of the same product.
Why did the county's days-on-market number change between reports? RAYAC's 2025 year-end report recorded a 9-day median. Its March 2026 snapshot showed that figure rising to 11 days, still fast by any historical standard, alongside a 5 percent increase in inventory compared to the prior year. More listings and slightly longer market times can coexist with a rising median, which is a separate compositional effect worth knowing before assuming a slower sale means a softening price.
If You Want the Real Number for Your Address
A countywide median is a useful headline and a poor budgeting tool. If you are trying to figure out what your specific submarket actually supports, whether you are pricing a listing in York City or sizing up what a move into the Northern district would cost, the honest answer requires pulling comparable sales for your specific street, not the county average.
That is the kind of number Spencer Blake can pull for you directly. Get a Free Home Valuation and find out what your address is actually worth, not what the county headline says it should be.